Will Whitney
Representation quality and the complexity of learning
Cross-posted from the CILVR blog.
In the last few years, there's been an explosion of work on learning good representations of data. From NLP123 to computer vision456 to reinforcement learning789, the field has never been hotter. However, defining precisely what we mean by a good representation can be tricky. This has led to a somewhat ad-hoc approach to evaluation in the literature, with each paper choosing its own measure or set of measures and a general sense that our evaluation methods aren't very robust.
Though I'm not a big fan of the evaluation protocol: linear classification on top of unsupervised features learned on ImageNet.
— Oriol Vinyals (@OriolVinyalsML) February 14, 2020
In a recent paper, Evaluating representations by the complexity of learning low-loss predictors10, we show that many notions of the quality of a representation for a task can be expressed as a function of the loss-data curve. This perspective allows us to see the limitations of existing measures and propose new ones that are more robust.
We think that evaluation is crucially important in the field right now and we don't want the measures that we and others have proposed to languish as purely theoretical exercises. Since these measures (ours and others) aren't trivial to implement or to compute, we are releasing a library called Reprieve for representation evaluation that aims to standardize the evaluation of representation quality. Whether you're using the measures that we proposed or several others, and no matter what ML library you use, you can evaluate representations with Reprieve.
Loss-data curves and existing measures
The loss-data curve, with the size of the training set on the X axis and validation loss on the Y axis, describes how an algorithm's performance varies based on the amount of training data it's given. Intuitively, the curve for a representation that allows the algorithm to learn efficiently (with little data) will lie to the left of the curve for a representation that makes learning less efficient. Meanwhile a representation that contains more predictive information will lead to a curve that goes lower as the training set size goes to infinity.
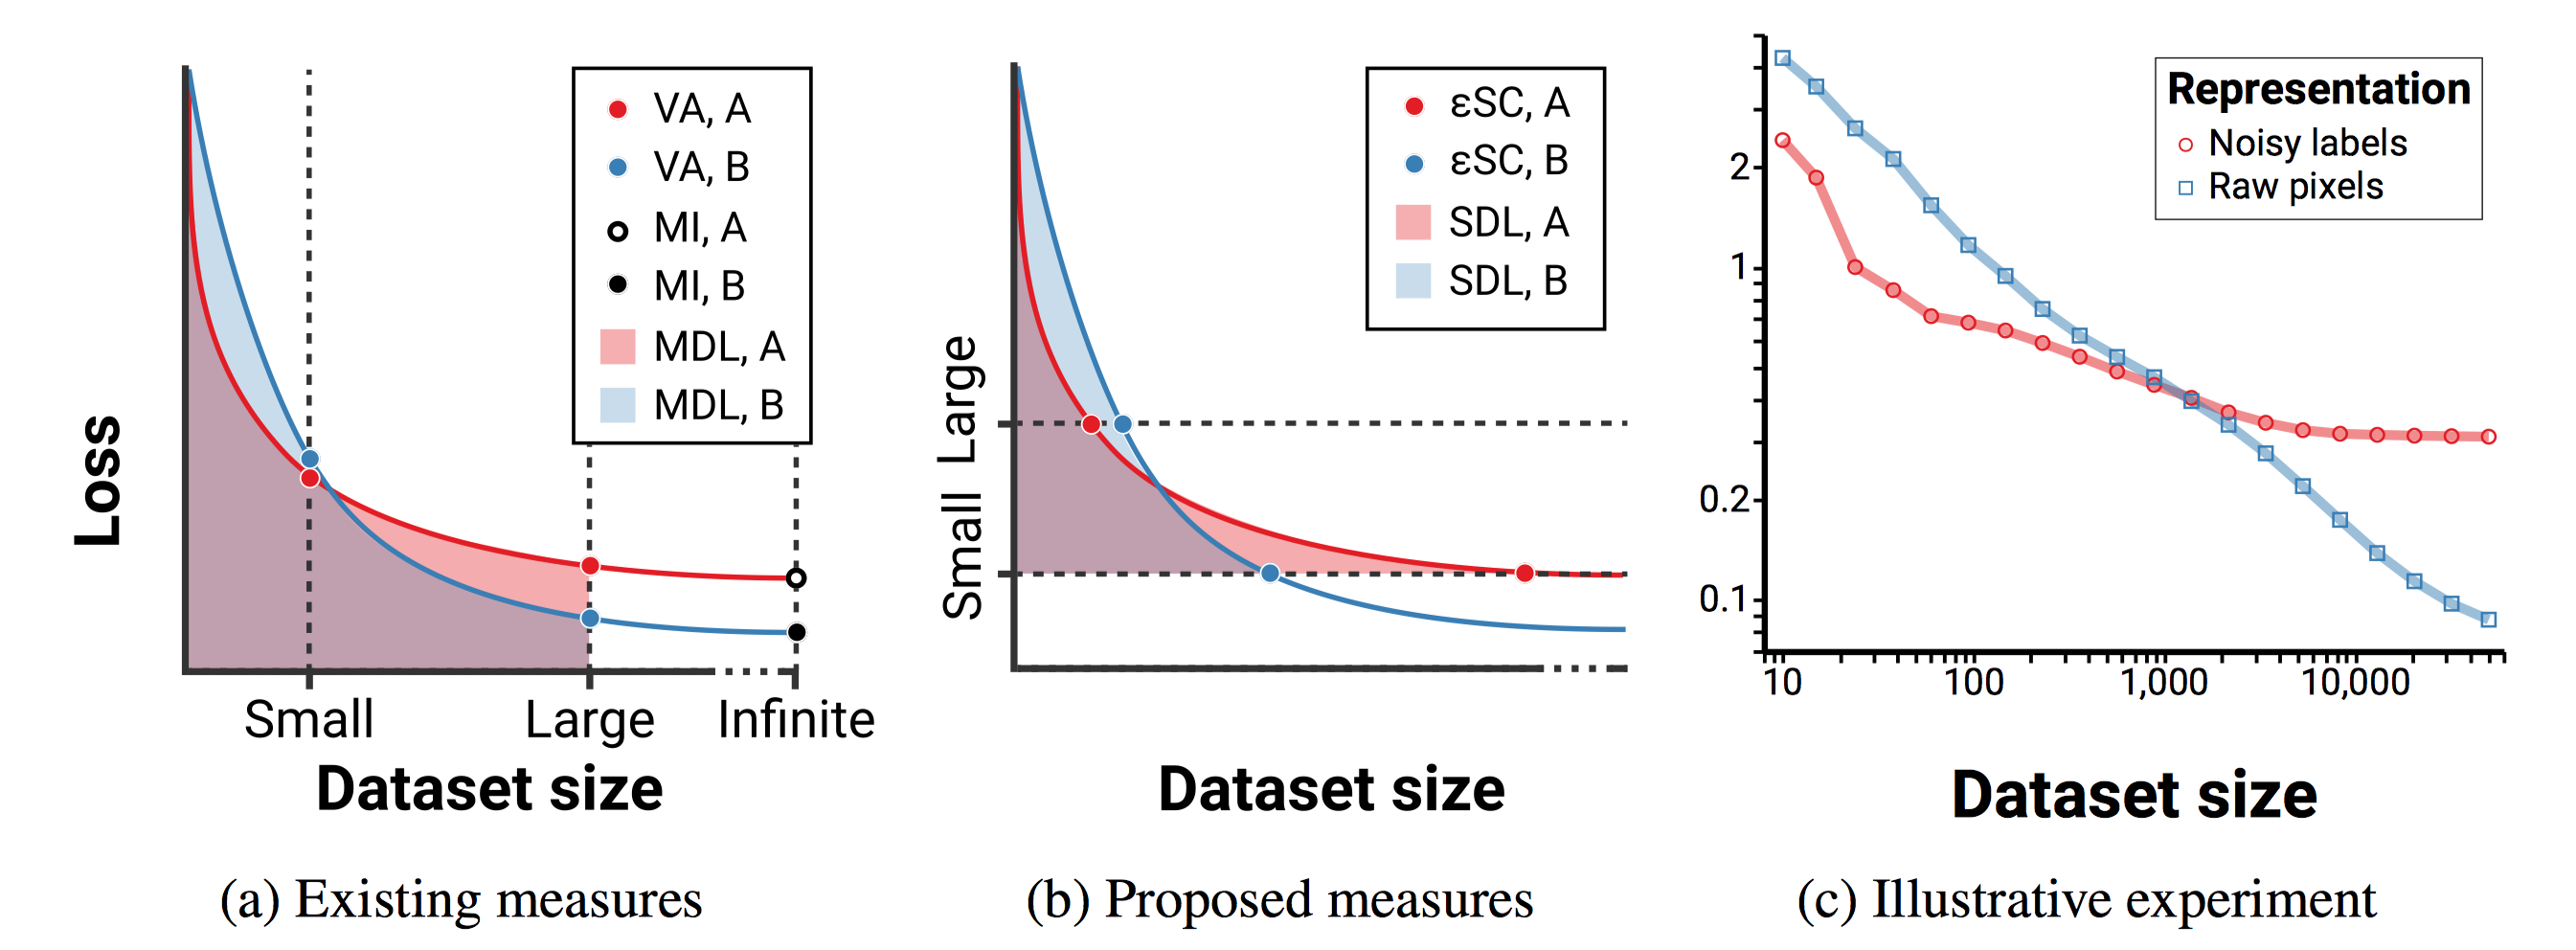
On the loss-data curve we can graphically show the meaning of several existing evaluation measures for representation quality (left panel).
Validation accuracy with limited data (VA) is the simplest measure. VA corresponds to picking some \(n\) for the dataset size and looking only at a vertical slice of the loss-data curve at that \(n\).
Mutual information (MI) attempts to measure the quality of a representation by its mutual information with the labels11. MI is equivalent to considering only the validation loss with infinite training data.
Minimum description length (MDL) is an interesting measure recently proposed by Voita et al. (2020)12. Given a fixed dataset, MDL measures the description length of the dataset's labels (the vector of all the Ys) given its observations (the vector of all the Xs) according to a particular encoding scheme. In the prequential or online coding scheme, a model is trained to predict \(p(Y^k \mid X^k)\) on a dataset of size \(k\), and then used to encode the \((k+1)^{\mathrm{th}}\) point. MDL corresponds to the area under the loss-data curve up to \(n\), the full size of the dataset.
An interesting feature of all these methods is that they depend on (or specify, for MI) a particular dataset size. This can be a bit tricky: how much data should an algorithm need to solve a new task? Provide too little data and no representation will allow any learning, but provide too much and only asymptotic loss will matter, not efficiency.
Instead, we will construct an evaluation procedure that measures a property of the data distribution and the learning algorithm, not a particular dataset or dataset size.
Surplus Description Length
We're going to build on the MDL idea to make a measure of representation quality. To do this, we measure the complexity of learning for a given data distribution and learning algorithm. We have two main goals for this representation evaluation measure:
- It should measure a fundamental property of the data distribution and learning algorithm.
- The measure shouldn't depend on a particular sample of a dataset from the data distribution, the size of the dataset, or the order of the points.
Defining surplus description length
To start with, imagine trying to efficiently encode a large number of samples of some random variable \(\mathbf{e}\) which takes discrete values in \(\{1 \ldots K\}\) with probability \(p(\mathbf{e})\). The best possible code for each sample leverages knowledge of the probability of observing that sample, and assigns a code length of \(- \log p(e_i)\) to each sampled value \(e_i\). This results in an expected length per sample of \[ \mathbb{E}_\mathbf{e} [\ell_p(\mathbf{e})] = \mathbb{E}_\mathbf{e} [- \log p(\mathbf{e})] = H(\mathbf{e}) \] where we use \(\ell_p\) to denote the negative log-likelihood loss for the distribution \(p\). Intuitively, the entropy \(H(\mathbf{e})\) represents the amount of randomness in \(\mathbf{e}\); if we know the outcome of the event we need to encode ahead of time, \(H(\mathbf{e}) = 0\) and we don't need to transmit anything at all.
If instead \(\mathbf{e}\) was encoded using some other distribution \(\hat p\), the expected length becomes \(H(\mathbf{e}) + D_{\mathrm{KL}}(p~||~\hat p)\). We call \(D_{\mathrm{KL}}(p~||~\hat p)\) the surplus description length (SDL) from encoding according to \(\hat p\) instead of \(p\).13 We can also write it as \[ \mathrm{SDL}(\hat p) = D_{\mathrm{KL}}(p~||~\hat p) = \mathbb{E}_{\mathbf{e} \sim p} \left[ \log p(\mathbf{e}) - \log \hat p(\mathbf{e}) \right] \] to highlight how SDL measures only the extra entropy that comes from not having the correct model.
SDL as a measure of representation quality
As our model learns we get a new \(\hat p\) at every training step. Similarly to MDL with online codes12, we measure the SDL of the learned model at each step and then sum them up. Writing the expected loss of running algorithm \(\mathcal{A}\) on a dataset with \(i\) points as \(L(\mathcal{A}_\phi, i)\), the SDL measure of representation quality is \[ m_{\mathrm{SDL}}(\phi, \mathcal{D}, \mathcal{A}) = \sum_{i=1}^\infty \Big[ L(\mathcal{A}_\phi, i) - H(\mathbf{Y} \mid \mathbf{X}) \Big]. \]
We show in the paper that MDL is a special case of SDL which assumes that the true distribution of \(\mathbf{Y} \mid \mathbf{X}\) is a delta mass. That is to say, \(H(\mathbf{Y} \mid \mathbf{X}) = 0\) and the labels have no randomness at all. This leads to some odd properties with real data, which typically has noise. MDL goes to infinity with the size of the dataset even for algorithms which learn the true data distribution, which makes numbers hard to compare. More worryingly, if we rank the quality of two representations using MDL, that ranking can (and in practice does) switch as we change the dataset size. That means our conclusions about which representation is better are totally dependent on how much data we have to evaluate them!
Since in practice we don't know the true entropy of the data distribution, we also propose a version of the SDL measure where we set some threshold \(\varepsilon\) as a criterion for success instead of using the true entropy of the data. As long as \(\varepsilon > H(\mathbf{Y} \mid \mathbf{X})\), this still has most of the same nice properties. A good way to set \(\varepsilon\) would be to run the learning algorithm on a large amount of data using the raw representation of the data, then set \(\varepsilon\) to the loss of that model plus a small slack term for estimation error.
We also propose a simpler measure called \(\varepsilon\) sample complexity, or \(\varepsilon\)SC, which is the number of training points required for the expected loss to drop below \(\varepsilon\). For full details on that check out the paper!
Representation evaluation in practice
With our tools in hand, we can examine some practical representations. Looking first at MNIST, we compare using the raw pixels to using neural encoders pretrained on supervised CIFAR classification or trained without supervision as a low-dimensional VAE on MNIST.
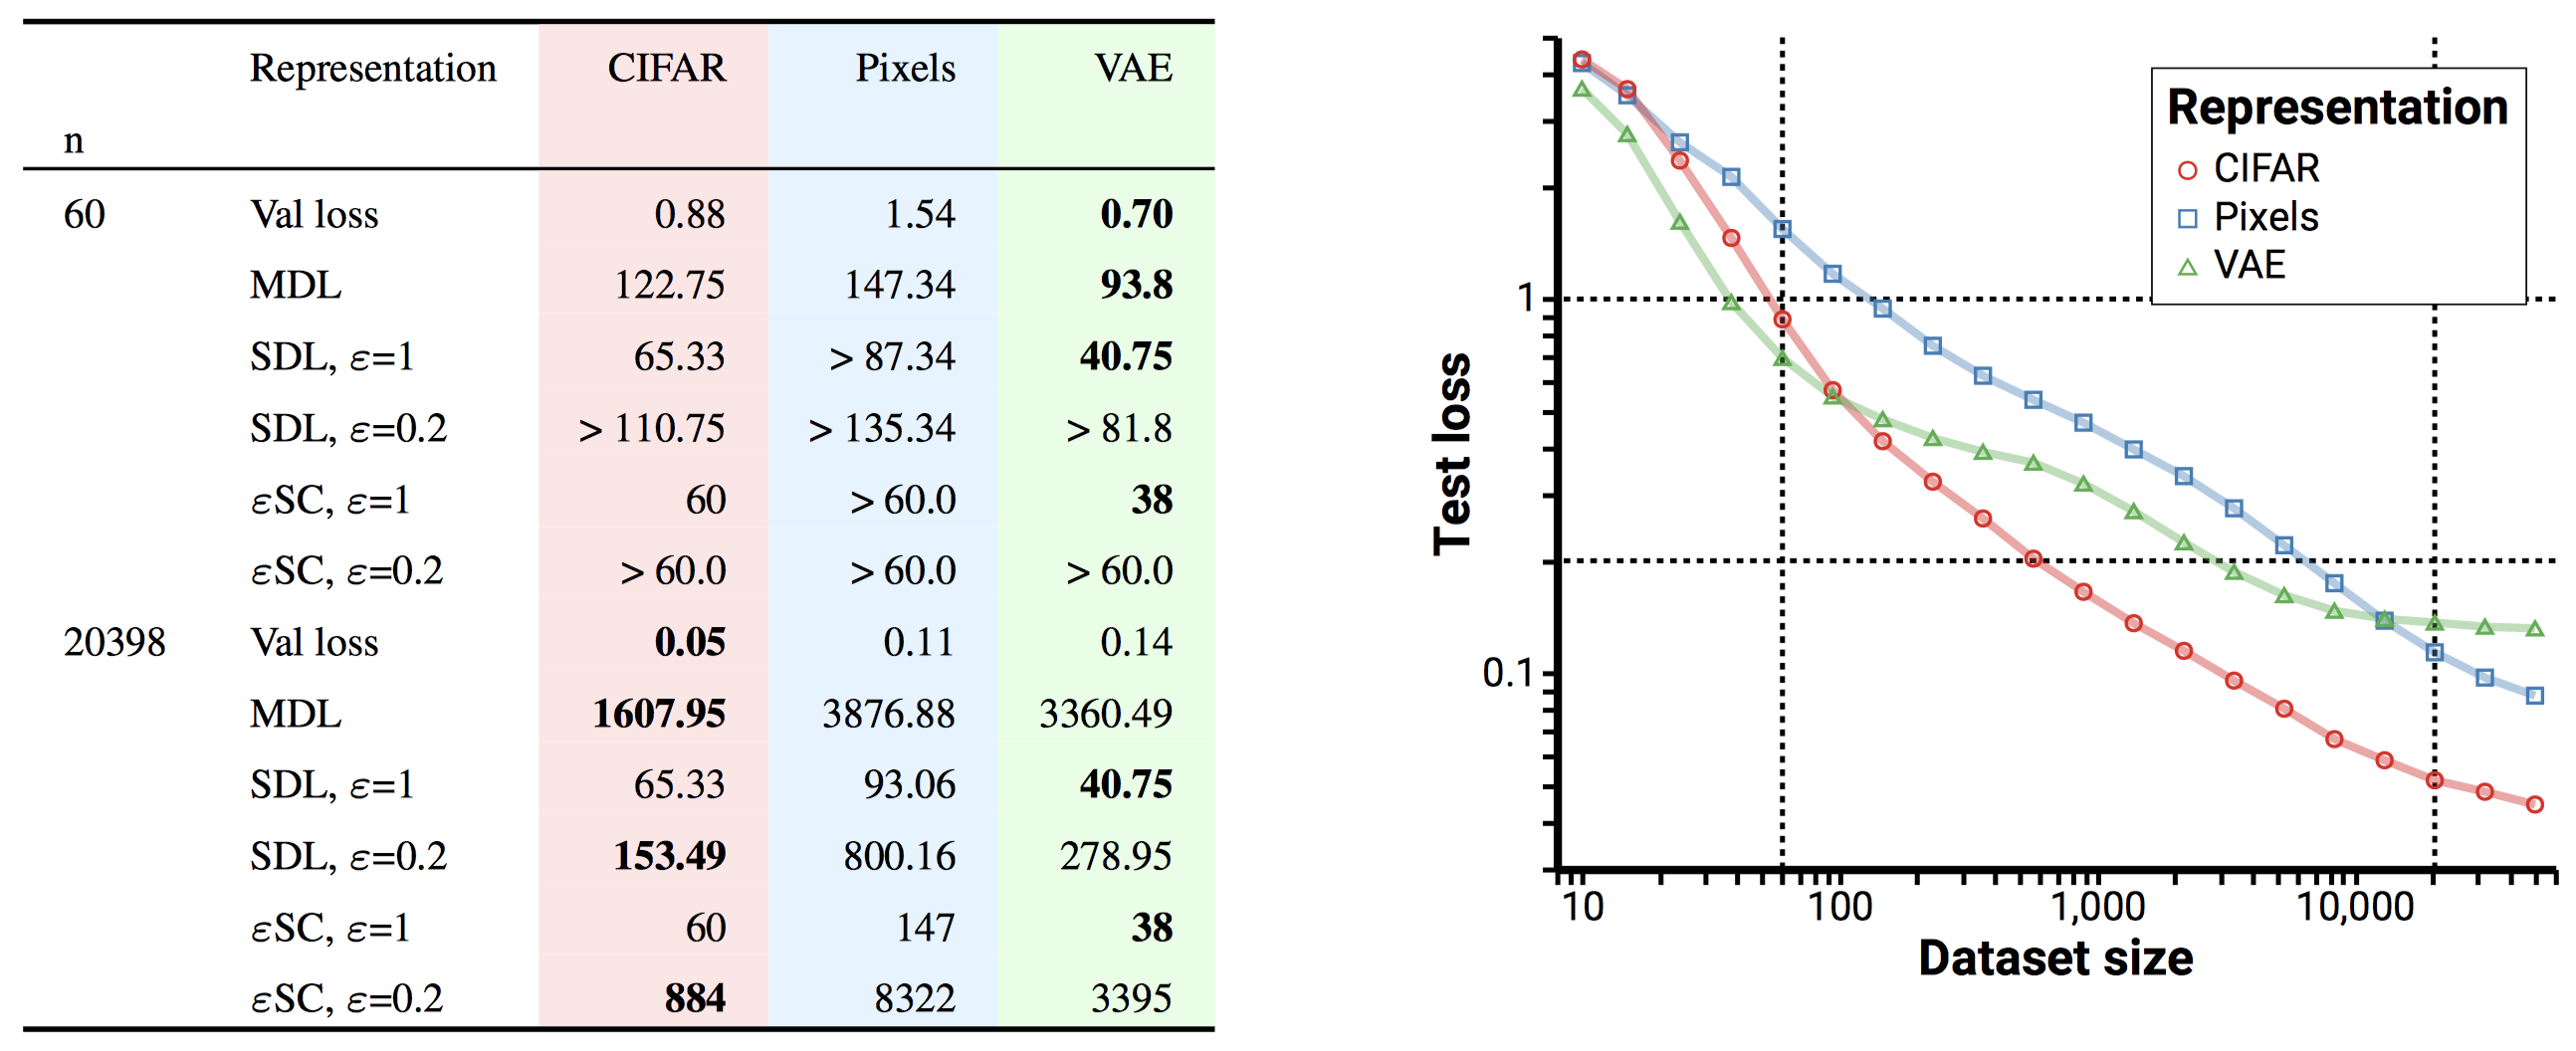
As you can see from the loss-data curve (right), these representations perform very differently! While the VAE representation allows the quickest learning at first, it makes achieving very low loss hard. Meanwhile the CIFAR pretrained representation supports learning that's more efficient than raw pixels for any loss.
Looking at the evaluation measures, we see that the existing measures like validation loss and MDL tend to switch their rankings when larger datasets are used for evaluation. Meanwhile SDL and \(\varepsilon\)SC know when there isn't enough data available to evaluate a representation, and once they make a judgement, it sticks.
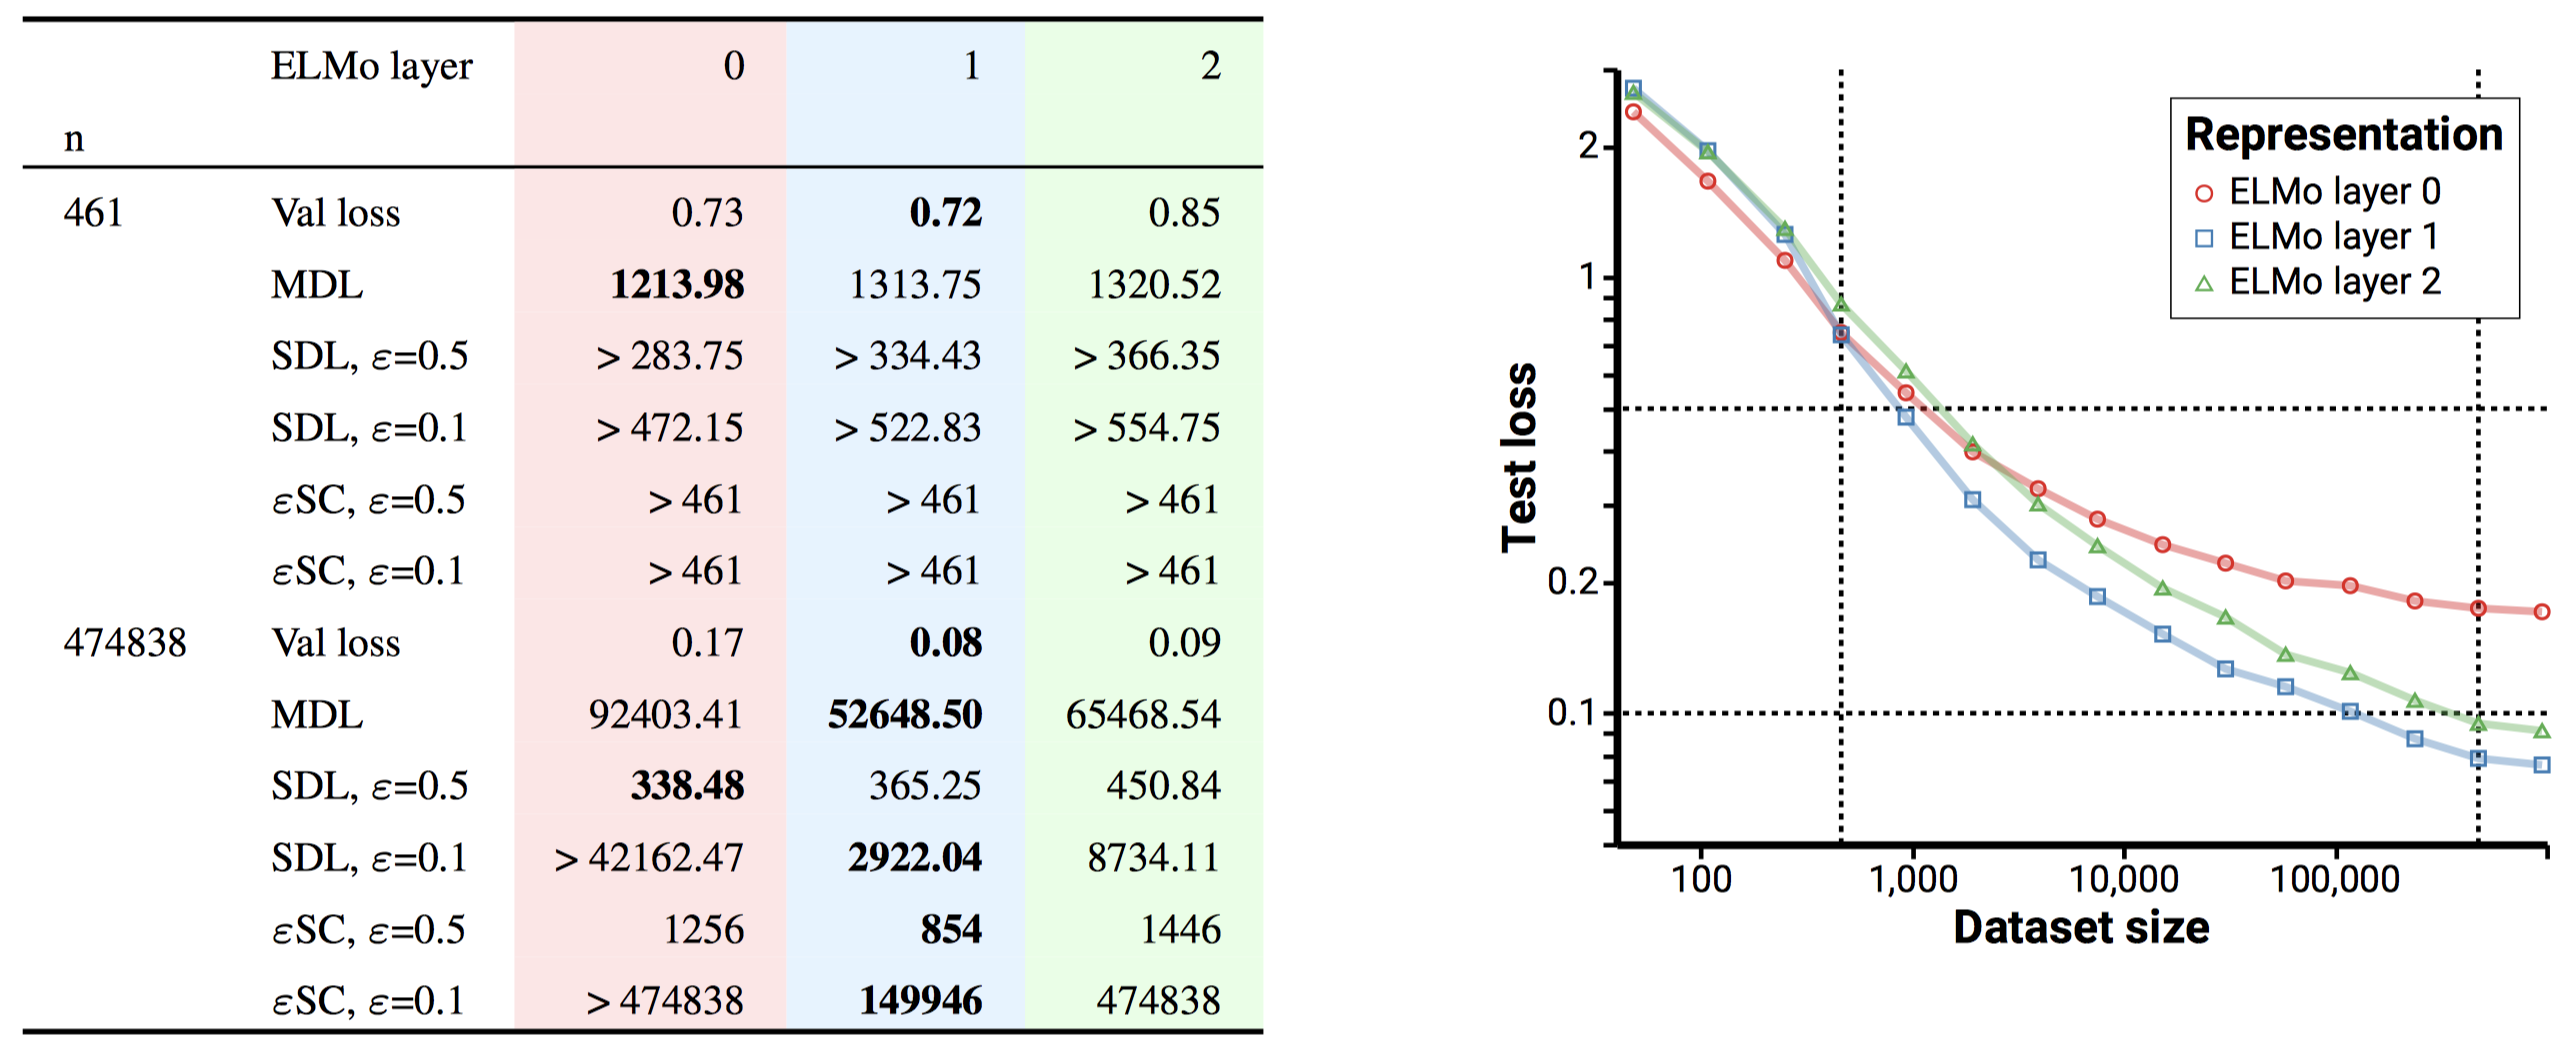
To show that this phenomenon isn't just limited to vision tasks or small datasets, we also provide experiments on a part of speech classification task using pretrained representations from ELMo2. Just like on MNIST, validation loss and MDL make very different predictions with small evaluation datasets than with large ones.
Better representation evaluation for everyone
Existing measures of representation quality, which are functions of a particular dataset rather than the data distribution, can have some tricky behavior. Whether you use our measures or not, we urge our fellow members of the representation learning community to think carefully about the measures and procedures that you use to evaluate representations.
Reprieve, our library for representation evaluation, is one tool that we think can help. By using the powerful program transformations provided by JAX, Reprieve is able to train the ~100 or so small networks required to construct a loss-data curve in parallel on one GPU in about two minutes. From there it can compute all of the measures that we mentioned today.
We hope that by standardizing on one codebase for evaluation, we in the representation learning community can move faster while producing results that are more comparable and more reproducible. If Reprieve is missing a measure that you think is important, submit a pull request!
-
Jacob Devlin, Ming-Wei Chang, Kenton Lee, Kristina Toutanova. BERT: Pre-training of Deep Bidirectional Transformers for Language Understanding. ↩︎
-
Matthew E. Peters, Mark Neumann, Mohit Iyyer, Matt Gardner, Christopher Clark, Kenton Lee, Luke Zettlemoyer. Deep contextualized word representations. ↩︎
-
Yinhan Liu, Myle Ott, Naman Goyal, Jingfei Du, Mandar Joshi, Danqi Chen, Omer Levy, Mike Lewis, Luke Zettlemoyer, Veselin Stoyanov. RoBERTa: A Robustly Optimized BERT Pretraining Approach. ↩︎
-
Ting Chen, Simon Kornblith, Mohammad Norouzi, Geoffrey Hinton. A Simple Framework for Contrastive Learning of Visual Representations. ↩︎
-
Aaron van den Oord, Yazhe Li, Oriol Vinyals. Representation Learning with Contrastive Predictive Coding. ↩︎
-
Kaiming He, Haoqi Fan, Yuxin Wu, Saining Xie, Ross Girshick. Momentum Contrast for Unsupervised Visual Representation Learning. ↩︎
-
Aravind Srinivas, Michael Laskin, Pieter Abbeel. CURL: Contrastive Unsupervised Representations for Reinforcement Learning. ↩︎
-
Carles Gelada, Saurabh Kumar, Jacob Buckman, Ofir Nachum, Marc G. Bellemare. DeepMDP: Learning Continuous Latent Space Models for Representation Learning. ↩︎
-
Amy Zhang, Rowan McAllister, Roberto Calandra, Yarin Gal, Sergey Levine. Learning Invariant Representations for Reinforcement Learning without Reconstruction. ↩︎
-
William F. Whitney, Min Jae Song, David Brandfonbrener, Jaan Altosaar, Kyunghyun Cho. Evaluating representations by the complexity of learning low-loss predictors. ↩︎
-
Note that to actually measure the mutual information between the random variables of the representation and data requires arbitrarily large models, infinite data, and unbounded computation. Mutual information is not a nice quantity to compute with. ↩︎
-
Elena Voita, Ivan Titov. Information-Theoretic Probing with Minimum Description Length. ↩︎
-
Encoding using the wrong distribution means that some event which happens often must have gotten a long code, and in exchange some uncommon event got a short code. It's as if someone made up a new language that made "the" 8 letters long and "eggplant" only 3; it would be convenient once a week when you type "eggplant", but really annoying the 100 times a day you type "the". ↩︎